Brand Insights
For Health Science Executives
Design Trends: Infographics – A Captivating Way for Bioresearch Brands to Share Data
Design Trends: Infographics – A Captivating Way for Bioresearch Brands to Share Data
Infographics are a growing communications trend and a perfect fit for Biomedical nonprofits and Life Science companies that need to communicate heavy data and grab their readers’ attention.
A carefully designed Infographic can make complex Bioresearch data more engaging by ensuring it is:
Easy to Scan and View
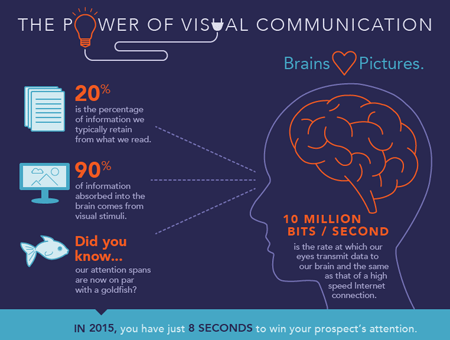
In today’s fast-paced world, Infographics are a growing trend to the point that some have become works of art. The latest statistics indicate that you have just 8 seconds to capture your prospects attention. (And that’s 4 seconds LESS than in 2000.) By trading long paragraphs and lengthy text for simple graphics and typography, Infographics present complex data in a visually arresting way that draws people in and quickly rewards them for their attention.
If your content contains many subtopics, Infographics enable you to segregate them into clean sections that viewers can quickly scan and absorb. Be mindful that some visuals may need the support of short-form text that provides enough background information so that viewers can understand the purpose of the research, data, etc.
Compelling & Attractive
People respond to facts, figures and statistics because they put abstract ideas into context quickly. Using the power of design, Infographics give life to important facts and numbers that might otherwise go unnoticed on a page. They draw people in, translate data, and enable you to decide what you want your audience to remember most.
Simple to Share
Because Infographics are compelling and succinct, people are much more likely to share them on social networks. This makes them especially effective for Biomedical nonprofits and Life Science companies that need to convey the impact their work can have on human health. Infographics also provide an opportunity to brand important information with your logo, brand colors, etc., so that your Bioresearch brand becomes inextricable from the story you’ve told.
You can embed an Infographic in an eNewsletter, post it to Facebook or LinkedIn, or even add it on Pinterest to encourage social sharing. Whatever form it takes, be sure your Infographic leads the viewer back to your website.
Getting Started
Remember that your goal is to tell a story, and Infographics only work if the story is there to begin with. Your Marketing Communications or Development team will benefit from starting with a messaging outline to ensure the story behind the visuals is compelling.
Ready to create an Infographic? Here are the types of information that translate well into a visual platform:
- Heavy Data
- Statistics & Numbers
- Comparisons (this vs. that)
- Timelines
- Maps
- Annual Report Financials
Source: Statistic Brain